Friday, December 17, 2010

Age Calculator

Calculate the age based on the Date of Birth and another date (default is the current date).

Date of Birth
Age at This Date
Age
= years months

= months

= weeks

= days

Dates should be entered in the US format mm/dd/yyyy, using four digits for the year.


http://www-users.med.cornell.edu/~spon/picu/calc/agecalc.htm

How Excel Works with Dates


Excel considers dates as numbers. Each date is assigned a unique serial number. For example, the 27th September 1999 was date serial 36430. Fortunately, you don't need to know this but the fact that all dates have numerical values can be very useful. Windows uses the 1900 date system in which 1st January 1900 is date serial 1, 2nd January 1900 is date serial 2 and so on.

Checking the serial number of a dateWhen you type a date into a cell, Excel shows you a date but is thinking of a number.

To find out the serial number of a date, select the cell containing the date then go to Format > Cells. Go to the Number tab and click General in the Category list. The date's serial number will appear in the Sample box on the right.

You can make use of these numbers in all sorts of ways. You can add a number to a date to give a date that number of days later (or subtract a number to get a date before), you can take one date from another to find out how many days in between. There are lots of ready-made date functions too.

Working Out a Person's Age

A person's age is the amount of time since they were born (I know you know that but the computer doesn't, and we have to start thinking like the computer). So, all we have to do is put today's date in one cell and the person's date of birth in another cell, then take their date of birth away from today and you get their age - right? Well, sort of... you get a number. Because you took a date serial from another date serial you get the number of days in between*[note]. It looks like this...

Age shown as a number of daysIn this example the formula in cell A3 is:

=A1-A2

We need to convert this number of days into a number of years. Most years have 365 days but every fourth year has 366 days. So the average number of years is 365.25. Let's modify our formula...

Age shown as a number of yearsIn this example the formula in cell A3 is:

=(A1-A2)/365.25

Note the brackets around the first part of the formula. Brackets mean "Work out this bit first...". I've used them here to stop Excel trying to divide A2 by 365.25 before taking it away from A1. Excel formulas work do any multiplying and dividing before it does adding and subtracting, but anything in brackets gets done first.

Now we can see a number of years, but it's still not quite right. We are getting an accurate result but we don't really want to see the fraction. As a last refinement we'll wrap the whole thing inside an INT() function to give us a whole number (an integer). This is better than changing the number of decimal places displayed, which would risk some numbers being rounded up and giving an incorrect result. Here's the finished result...

Age shown as whole yearsIn this example the formula in cell A3 is:

=INT((A1-A2)/365.25)

*Note: In fact, to start with, you get another date. Confused? Don't be... Excel is trying to help but has misunderstood what we need. In date calculations, the result cell gets automatically formatted the same way as the first cell in the formula. Because the first cell was formatted as a date Excel showed you the result as a date, although you wanted to see a number. Just reformat the cell manually by going to Format > Cells > General

How to Calculate Age Range From Birth Date in An Excel Spreadsheet

Ever wonder the exact age of someone? Not just how many years old the person is, but his age down to the very second? If so, this Excel activity is the perfect solution. By simply entering today's date, the birth date and a few simple functions, the program can calculate a person's age in years, months, days, hours and even seconds. Follow the steps and easily calculate the age range from any birth date in an Excel spreadsheet.

# Enter the date data. In cell A1, type in today's date. In cell A2, type in the person's birth date.

#Enter the formula to display the age in years. In cell A3, enter the following formula: "=(A1-A2)/365.25." Then click "Enter." The result displayed is the person's age in years.

#Type the formula to display the age in months. In cell A4, enter the formula "=A3*12" and click "Enter." The person's age in months will display.

#Enter the formula to display the age in days. In cell A5, enter the formula "=A3*365.25" and hit "Enter." The person's age in days will show.

#Type the formula to display the age in hours. In cell A6, enter "=A5*24" and click "Enter." The person's age in hours will display.

#To show the person's age in seconds, type the formula "=A6*60" into cell A7 and click "Enter." The number displayed is the person's age in seconds.


Read more: How to Calculate Age Range From Birth Date in An Excel Spreadsheet | eHow.com http://www.ehow.com/how_5071205_calculate-birth-date-excel-spreadsheet.html#ixzz18MF2DS00

Sunday, December 12, 2010

Excel Charts

Creating Charts

In Microsoft Excel, you can represent numbers in a chart. On the Insert tab, you can choose from a variety of chart types, including column, line, pie, bar, area, and scatter. The basic procedure for creating a chart is the same no matter what type of chart you choose. As you change your data, your chart will automatically update.

You select a chart type by choosing an option from the Insert tab's Chart group. After you choose a chart type, such as column, line, or bar, you choose a chart sub-type. For example, after you choose Column Chart, you can choose to have your chart represented as a two-dimensional chart, a three-dimensional chart, a cylinder chart, a cone chart, or a pyramid chart. There are further sub-types within each of these categories. As you roll your mouse pointer over each option, Excel supplies a brief description of each chart sub-type.


Creating Charts

In Microsoft Excel, you can represent numbers in a chart. On the Insert tab, you can choose from a variety of chart types, including column, line, pie, bar, area, and scatter. The basic procedure for creating a chart is the same no matter what type of chart you choose. As you change your data, your chart will automatically Update. This lesson teaches you how to create a chart in Excel.

* Create a Chart
* Apply a Chart Layout
* Add Labels
* Switch Data
* Change the Style of a Chart
* Change the Size and Position of a Chart
* Move A Chart to a Chart Sheet
* Change the Chart Type

Creating Excel Functions, Filling Cells, and Printing

By using functions, you can quickly and easily make many useful calculations, such as finding an average, the highest number, the lowest number, and a count of the number of items in a list. Microsoft Excel has many functions you can use. You can also use Microsoft Excel to fill cells automatically with a series.For example, you can have Excel automatically fill your worksheet with days of the week, months of the year, years, or other types of series.

A header is text that appears at the top of every page of your printed worksheet. A footer is text that appears at the bottom of every page of your printed worksheet. You can use a header or footer to display among other things titles, page numbers, or logos. Once you have completed your Excel worksheet, you may want to print it. This lesson teaches you how to use functions, how to create a series, how to create headers and footers, and how to print.

* Using Reference Operators
* Understanding Functions
* Fill Cells Automatically
* Create Headers and Footers
* Set Print Options
* Print

Entering Excel Formulas and Formatting Data

A major strength of Excel is that you can perform mathematical calculations and format your data. In this lesson, you learn how to perform basic mathematical calculations and how to format text and numerical data.

* Set the Enter Key Direction
* Perform Mathematical Calculations
* AutoSum
* Perform Automatic Calculations
* Align Cell Entries
* Perform Advanced Mathematical Calculations
* Copy, Cut, Paste, and Cell Addressing
* Insert and Delete Columns and Rows
* Create Borders
* Merge and Center
* Add Background Color
* Change the Font, Font Size, and Font Color
* Move to a New Worksheet
* Bold, Italicize, and Underline
* Work with Long Text
* Change a Column's Width
* Format Numbers

Entering Text and Numbers in Microsoft Excel

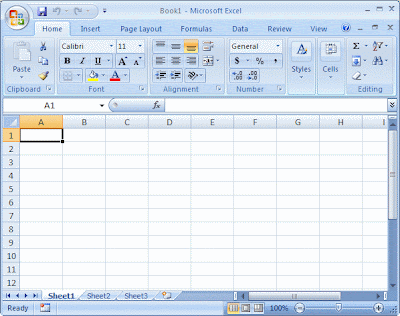
Microsoft Excel is an electronic spreadsheet that runs on a personal computer. You can use it to organize your data into rows and columns. You can also use it to perform mathematical calculations quickly. This tutorial teaches Microsoft Excel basics. Although knowledge of how to navigate in a Windows environment is helpful, this tutorial was created for the computer novice. This lesson will introduce you to the Excel window. You use the window to interact with Excel.

* The Microsoft Excel Window
* The Microsoft Office Button
* The Quick Access Toolbar
* The Title Bar
* The Ribbon
* Worksheets
* The Formula Bar
* The Status Bar
* Move Around a Worksheet
* Go To Cells Quickly
* Select Cells
* Enter Data
* Edit a Cell
* Wrap Text
* Delete a Cell Entry
* Save a File
* Close Excel

Start With Microsoft Excel

To use Microsoft Excel, there are various ways you can start it:

* As a regular Microsoft Windows application, to use Microsoft Excel, you can click Start -> (All) Programs -> Microsoft Office -> Microsoft Office Excel 2007


* You can also create a shortcut on the desktop, in Windows Explorer, or in My Computer. To create a shortcut, you can click Start -> (All) Programs -> Microsoft Office, right-click and hold your right mouse on Microsoft Office Excel and drag (with the right mouse button) to the desktop. On the menu that appears, click Create Shortcut Here. Another technique you can use consists of opening My Computer, expanding the drive, the Program Files folder, the Microsoft Office folder, the Office12 folder, right-clicking Excel, clicking Create Shortcut, right-clicking the new shortcut and clicking Cut, right-click your desktop and click Paste.

* If you are using My Computer or Windows Explorer, you can open the Program Files folder, then Microsoft Office, then Office, and double-click Excel

* You can create an empty document on your desktop and use it to launch Microsoft Excel. To do that, you would right-click an empty area on the desktop, position the mouse on New -> Microsoft Office Excel Worksheet, type a name for the document, such as Time Sheet, and press Enter twice

* If you see a file in My Computer, Windows Explorer, My Network Places, Microsoft Outlook, or you receive a document by e-mail, you can launch Microsoft Excel by double-clicking the file or the attachment

The classic way users launch Microsoft Excel is from the Start menu on the task bar. You can also start the application from a shortcut on the desktop. There are many ways you can create a shortcut on your desktop. To create a Microsoft Excel shortcut on the desktop, do one of the following:


To start Microsoft Excel, from the Taskbar, click
Start -> (All) Programs -> Microsoft Office -> Microsoft Office Excel

Microsoft Excel

Microsoft Excel is a spreadsheet application written and distributed by Microsoft for Microsoft Windows and Mac OS X. It features calculation, graphing tools, pivot tables and a macro programming language called Visual Basic for Applications. It has been a very widely applied spreadsheet for these platforms, especially since version 5 in 1993. Excel forms part of Microsoft Office. The current versions are 2010 for Windows and 2011 for Mac.

Basic operation

Microsoft Excel has the basic features of all spreadsheets, using a grid of cells arranged in numbered rows and letter-named columns to organize data manipulations like arithmetic operations. It has a battery of supplied functions to answer statistical, engineering and financial needs. In addition, it can display data as line graphs, histograms and charts, and with a very limited three-dimensional graphical display. It allows sectioning of data to view its dependencies on various factors from different perspectives (using pivot tables and the scenario manager). And it has a programming aspect, Visual Basic for Applications, allowing the user to employ a wide variety of numerical methods, for example, for solving differential equations of mathematical physics, and then reporting the results back to the spreadsheet. Finally, it has a variety of interactive features allowing user interfaces that can completely hide the spreadsheet from the user, so the spreadsheet presents itself as a so-called application, or decision support system (DSS), via a custom-designed user interface, for example, a stock analyzer, or in general, as a design tool that asks the user questions and provides answers and reports. In a more elaborate realization, an Excel application can automatically poll external databases and measuring instruments using an update schedule,analyze the results, make a Word report or Power Point slide show, and e-mail these presentations on a regular basis to a list of participants.

Excel Charts

Like some other spreadsheet applications, Microsoft Excel supports charts, graphs or histograms generated from specified groups of cells. The generated graphic component either can be embedded within the current sheet, or added as a separate object.

These displays are dynamically updated if cells change content, making a useful design tool. For example, suppose that the important design requirements are displayed visually; then, in response to a user's change in trial values for parameters, the curves describing the design change shape, and their points of intersection shift, assisting the selection of the best design.

* 8.1 Excel 2.0
* 8.2 Excel 5.0
* 8.3 Excel 2000
* 8.4 Excel 2007
* 8.5 Excel 2010

Versions

* 9.1 Microsoft Windows
* 9.2 Apple Macintosh
* 9.3 OS/2

http://en.wikipedia.org